#CTF #PHP #VSCode
# 环境准备
- VScode
- VMware
# 宿主机配置
- 将 ThinkPHP 5.0.5(或者其他源码)下载到宿主机当中,使用 VScode 打开项目
- 安装 PHP Debug
- 点击左侧栏中的运行,选择创建 launch.json 文件,写入配置
{
“name”: “Listen for XDebug”,
“type”: “php”,
“request”: “launch”,
“pathMappings”: {
“虚拟机当中的源码位置”: “${workspaceRoot}”
},
“port”: 9000 // 默认 XDebug 端口
}
# 虚拟机配置
- 首先安装 XDebug,官网有非常详细的安装教程。
- 修改 XDebug.ini 配置,这里建议去写一个 phpinfo () 文件,在这里面查看
Additional .ini files parsed
/etc/php/7.4/apache2/conf.d/20-xdebug.ini
编辑此配置文件,一般第一行 zend_extension 是已经写好的,如果没有的话加上 xdebug 的路径就行
接着在下面写入其他配置
[XDebug]
xdebug.remote_enable = 1
xdebug.remote_autostart = 1
xdebug.remote_port = 9000 // 端口可以自定义,与 vscode 的保持一致就行
xdebug.remote_connect_back = 1
xdebug.auto_trace = 1
xdebug.collect_includes = 1
xdebug.collect_params = 1
; xdebug.remote_log = /var/log/xdebug.log// 可选
关于配置以及 xdebug 原理之后会详细说。
- 重启服务,我的是 apache,使用
service apache2 restart重启服务。
# 开始调试
VScode 中,在需要调试的地方下好断点,然后在点击运行中的开始调试
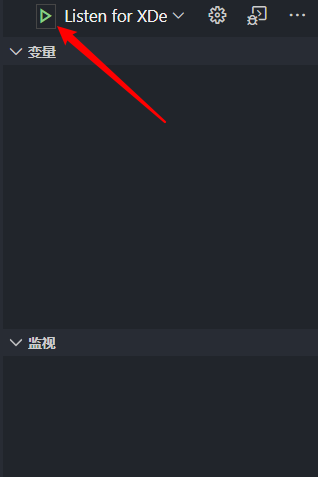
vscode 就会开始监听 9000 端口,等待 xdebug 的连接,然后去访问会触发断点的网页即可。
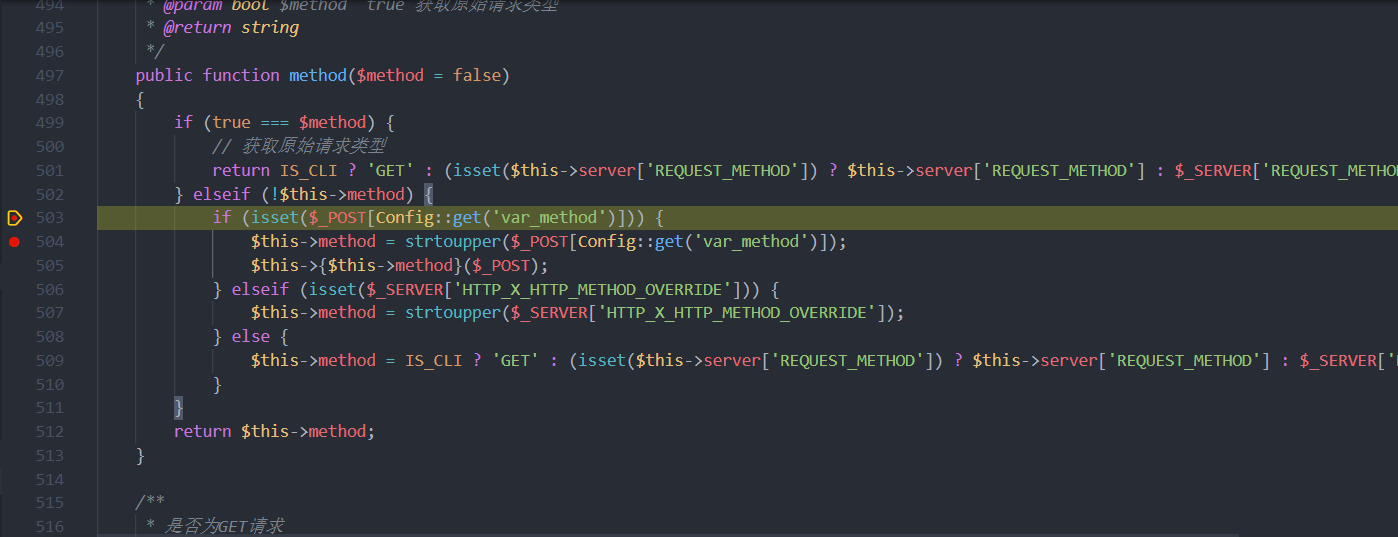 可以看到成功触发断点。
# XDebug 原理
首先 XDebug 需要客户端以及服务端。
服务端就是我们在 VMware 中安装的 XDebug,而客户端一般来说像 PHPStorm 这样的 IDE 自带,或者 VScode 自己去安装 PHP Debug。
当进行 XDebug 调试时,首先客户端会开始监听端口,等待 XDebug 的连接,连接成功则开始调试。如图所示:
图片来自 http://guojianxiang.com/posts/2015-09-06-PHP_Debug_Tool-Xdebug.html
这里面是将 xdebug.remote_host 设为一个固定值,也就是说只会朝 remote_host 指向的 IP 发送调试请求。
但是如果将 xdebug.remote_connect_back 的值设为 1,即可取消此限制。
设置这个值之后,xdebug 会从 http 请求的头部获取客户端的 ip 当作 remote_host,而原本的 remote_host 即使设置了,也会忽略。